Introduction
There are multiple fungal leaf blights that affect corn production in Florida; Southern rust (puccinia polysora), common rust (Puccinia sorghi), Northern corn leaf blight (Exserohilum turcicum), Southern corn leaf blight (Helminthosporium maydis), and Northern corn leaf spot (Helminthosporium zeicola) are among some of the common diseases present. Although each disease varies in its severity, all have the potential to be yield limiting if conditions are conducive to disease development. Fungicide applications can be an effective way to increase yields for susceptible hybrids under heavy disease pressure. The number of and timing of these applications is important to ensure an adequate return on yield to justify the cost of the fungicide application. Research conducted by the Corn Disease Working Group in 2014 by multiple universities across 15 states (including Ontario, CA) concluded that the most consistent yield response occurred when spring planted corn was treated between vegetative tassel (VT) and pollination (R1) (Table 1). Although disease severity is decreased by fungicide applications to corn in the vegetative stages, it seldom results in an increase in yield. Data from this study showed that providing protection during VT-R2 resulted in the greatest yield response.
Considerations For Florida
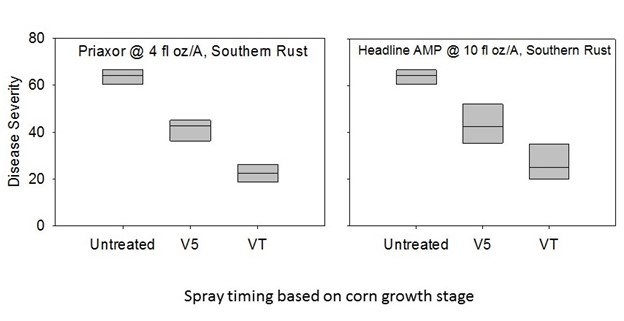
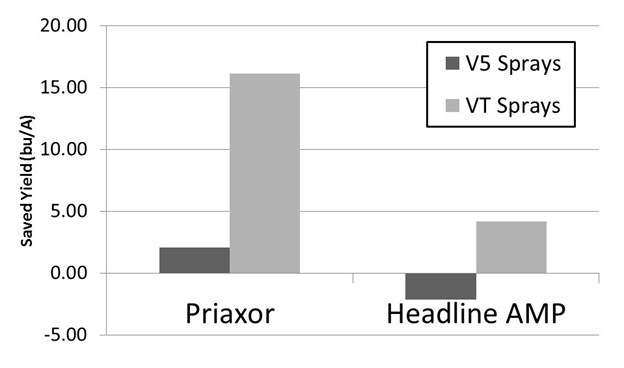
In Florida, corn is often planted twice in the same season. The late planted corn is at higher risk for disease development and earlier applications (V3-V8) may be warranted. However, for corn planted early (March-April) these data are reflective of the conditions here in Florida. Foliar fungicide trails conducted in 2017 by Dr. Nicholas Dufault (UF/IFAS Extension, Department of Plant Pathology) revealed that disease severity was reduced the most when applications occurred at the VT growth stage (Figure 1). Applications at the VT stage also resulted in the highest return on yield (Figure 2).
| Timing of application | # of fungicides tested | # of observations | Mean yield response compared to non-treated control (bu/A)* |
| Early (V3-V8) | 14 | 143 | 2.3 |
| Standard (VT-R2) | 16 | 207 | 7.6 |
| Double (V5 + VT/R1) | 8 | 112 | 4.9 |
| *Mean calculated over all fungicides compared to individual state trials | |||
| 2014 Regional Corn Fungicide Summary | |||
Table 1. Mean corn yield responses for fungicide treatments for foliar disease. Data collected across 15 states and compiled by the Corn Disease Working Group.
Cultural Practices for Controlling Corn Diseases
- Plant a hybrid resistant to a disease you have a perennial problem with.
- Manage crop residue through tillage. Most fungal diseases that affect corn foliage survive in the remaining infected crop residue.
- Crop rotation to a non-host crop to reduce pathogen levels.
Factors Influencing Pesticide Application Decision
It is important for growers to minimize input costs, especially when commodity prices are low. The decision to apply a fungicide should be weighted and based off of several factors including:
- Yield potential of the crop
- Susceptibility of hybrid to a given pathogen
- Growth stage of the crop
- Disease incidence & severity
- Aggressiveness of the pathogen
- Weather conditions
- Price of corn or silage
- Field history (rotation or corn on corn) and
- The price of the fungicide application.
Fungicides have the potential to increase yields by 5 to 10 bushels per acre depending upon the severity of the disease present. The cost of a fungicide application can range from $12 to $36 depending on the fungicide applied and the application method. The least expensive manner of application would be through overhead irrigation, followed by ground application and the most expensive, aerial application. Tables 2 and 3 show the break-even scenarios for corn fungicide applications given a range of application costs and commodity prices. The numbers in the center of the graph represent the increase in yield that would be needed in order to break even.
| Break-even scenarios for field corn | |||||||
| Corn price ($/bu) | Application cost ($/A) | ||||||
| $12 | $16 | $20 | $24 | $28 | $32 | $36 | |
| $3.00 | 4.0 | 5.3 | 6.7 | 8.0 | 9.3 | 10.7 | 12.0 |
| $4.00 | 3.0 | 4.0 | 5.0 | 6.0 | 7.0 | 8.0 | 9.0 |
| $5.00 | 2.4 | 3.2 | 4.0 | 4.8 | 5.6 | 6.4 | 7.2 |
| $6.00 | 2.0 | 2.7 | 3.3 | 4.0 | 4.7 | 5.3 | 6.0 |
| $7.00 | 1.8 | 2.3 | 2.9 | 3.4 | 4.0 | 4.6 | 5.1 |
| $8.00 | 1.5 | 2.0 | 2.5 | 3.0 | 35 | 4.0 | 4.5 |
| $9.00 | 1.3 | 1.8 | 2.2 | 2.7 | 3.1 | 3.6 | 4.0 |
| $10.00 | 1.2 | 1.6 | 2.0 | 2.4 | 2.8 | 3.2 | 3.6 |
Table 2. Break even scenarios for corn given a range of applications costs and corn prices. Numbers in the middle of the graph represent the bushels per acre increase that is needed to break even from the cost of the fungicide application.
| Break-even scenarios for corn silage | |||||||
| Silage price ($/ton) | Application cost ($/A) | ||||||
| $12 | $16 | $20 | $24 | $28 | $32 | $36 | |
| $41.00 | 0.29 | 0.39 | 0.49 | 0.59 | 0.68 | 0.78 | 0.88 |
| $49.00 | 0.24 | 0.33 | 0.41 | 0.49 | 0.57 | 0.65 | 0.73 |
| $57.00 | 0.21 | 0.28 | 0.35 | 0.42 | 0.49 | 0.56 | 0.63 |
| $65.00 | 0.16 | 0.25 | 0.31 | 0.37 | 0.43 | 0.49 | 0.55 |
| $73.00 | 0.15 | 0.22 | 0.27 | 0.33 | 0.38 | 0.44 | 0.49 |
| $81.00 | 0.15 | 0.20 | 0.25 | 0.30 | 0.35 | 0.40 | 0.44 |
| $89.00 | 0.13 | 0.18 | 0.22 | 0.27 | 0.31 | 0.36 | 0.40 |
| $97.00 | 0.12 | 0.16 | 0.21 | 0.25 | 0.29 | 0.33 | 0.37 |
Table 3. Break even scenarios for corn silage given a range of applications costs and corn prices. Numbers in the middle of the graph represent the ton per acre increase that is needed to break even from the cost of the fungicide application.
Conclusions
Multiple applications of foliar fungicides in corn have not been shown to be economically feasible. However, if disease severity and hybrid susceptibility is high and weather conditions are conducive to pathogen development, multiple applications may be justified. If you are have difficulties deciding on whether or not to apply foliar fungicides to your corn, please contact your local Extension office for more resources and guidance.
References
Corn Disease Working Group. 2017. Management of Corn Diseases; Fungicide Efficacy for Control of Corn Diseases. https://fyi.uwex.edu/fieldcroppathology/files/2015/04/CDWG-Fungicide-efficacy-table_2017_final-.pdf
Dufault, N. and Velez-Climent, M. C. 2017. Corn Disease Management: When to Apply a Fungicide? UF/IFAS. http://nwdistrict.ifas.ufl.edu/phag/2017/06/16/corn-disease-management-when-to-apply-a-fungicide/
Jackson-Ziems, T. and Harbour, J. D. 2015. Foliar fungicide comparison for southern rust management, stay green, push lodging and yield in Nebraska. Cropwatch.unl.edu
Kelly, M., 2015. Foliar Diseases and Fungicide Applications in Corn. University of Tennessee. http://news.utcrops.com/2017/06/foliar-diseases-fungicide-applications-corn/
Poston, D. 2014. Corn Hybrid Response to Dupont™ Approach® Prima Fungicide in Georgia. Pioneer Research Update. https://www.pioneer.com/home/site/us/pioneer_growingpoint_agronomy/2014/dupont-aproach-prima-fungicide-georgia/
 0
0
